Today’s databases are simultaneously ubiquitous and frustratingly inaccessible to most people. Your own data likely lives in thousands of databases at various companies and organizations, but if you wanted to create a database for yourself in which to store data and share it, you’d need the skills of both a system administrator and a software engineer. By virtue of the complexity of database management systems (and market forces), your data either lives in other people’s databases or in hard-to-share unstructured files on your computer. If it was easier to create and share databases, more people and teams would use them to manage and own their data.
To make this concrete, imagine a journalist or student that’s looking to create a database around a new dataset and build a visualization they host on a website. Using existing database tools, they have to secure a machine, install Postgres/MySQL, update various configuration settings to allow incoming connections, and create and host a web application to gatekeep the database credentials. Instead, what if our user could: 1) Register for an account on a service provided by their newsroom or school, 2) Issue a create database
command and make their database publicly accessible in read only mode, and 3) Issue SQL from the command line or over HTTP?
Toward that vision, I’ve been building ayb, which is a multi-tenant database management system with easy-to-host instances that enable you to quickly register an account, create databases, share them with collaborators, and query them from a web application or the command line. With ayb
, all your (data)base can finally belong to you. ayb
is open source (Apache 2.0-licensed) and requires a single command to start a server. ayb
features:
ayb
databases are just SQLite files, and ayb
relies on SQLite for query processing. SQLite is the most widely used database on the planet, and if you one day decide ayb
isn’t for you, you can walk away with your data in a single file. (We’ll support other formats like DuckDB’s after its storage format stabilizes.)ayb
instance is like GitHub for your databases: once you create an account on an ayb
instance, you can create databases quickly and easily. Next on the roadmap are features like authentication and permissions so that you can easily share your databases with particular people or make them publicly accessible.ayb
is easy to get up and running, you shouldn’t have to be a system administrator to get started. Each ayb
instance can serve multiple users’ databases, so that on a team, in a classroom, or in a newsroom, one person can get it running and everyone else can utilize the same instance. Once ayb
has authentication and permissions, I’ll plan on running a public ayb
instance so people can spin up databases without having to run their own instance. Clustering/distribution is on the roadmap so that eventually, if your instance ever needed to, it could run on multiple nodes.ayb
exposes databases over an HTTP API. Other wire protocols (e.g., the PostgreSQL wire protocol) are on the roadmap for broader compatibility with existing applications.As of June 2023, ayb
is neither feature complete nor production-ready. Functionality like authentication, permissions, collaboration, isolation, high availability, and transaction support are on the Roadmap but not available today. If you want to collaborate, reach out!
In the rest of this article, you can:
ayb
action in an end-to-end exampleayb
is for in students, sharers, and sovereigns.ayb
is written in Rust, and is available as the ayb
crate. Assuming you have Rust installed on your machine, installing ayb
takes a single command:
cargo install ayb
An ayb
server stores its metadata in SQLite or PostgreSQL, and stores the databases it’s hosting on a local disk. To configure the server, create an ayb.toml
configuration file to tell the server what host/port to listen for connections on, how to connect to the database, and the data path for the hosted databases:
$ cat ayb.toml
host = "0.0.0.0"
port = 5433
database_url = "sqlite://ayb_data/ayb.sqlite"
# Or, for Postgres:
# database_url = "postgresql://postgres_user:test@localhost:5432/test_db"
data_path = "./ayb_data"
Running the server then requires one command
$ ayb server
Once the server is running, you can set its URL as an environment variable called AYB_SERVER_URL
, register a user (in this case, marcua
), create a database marcua/test.sqlite
, and issue SQL as you like. Here’s how to do that at the command line:
$ export AYB_SERVER_URL=http://127.0.0.1:5433
$ ayb client register marcua
Successfully registered marcua
$ ayb client create_database marcua/test.sqlite
Successfully created marcua/test.sqlite
$ ayb client query marcua/test.sqlite "CREATE TABLE favorite_databases(name varchar, score integer);"
Rows: 0
$ ayb client query marcua/test.sqlite "INSERT INTO favorite_databases (name, score) VALUES (\"PostgreSQL\", 10);"
Rows: 0
$ ayb client query marcua/test.sqlite "INSERT INTO favorite_databases (name, score) VALUES (\"SQLite\", 9);"
Rows: 0
$ ayb client query marcua/test.sqlite "INSERT INTO favorite_databases (name, score) VALUES (\"DuckDB\", 9);"
Rows: 0
$ ayb client query marcua/test.sqlite "SELECT * FROM favorite_databases;"
name | score
------------+-------
PostgreSQL | 10
SQLite | 9
DuckDB | 9
Rows: 3
The command line invocations above are a thin wrapper around ayb
’s HTTP API. Here are the same commands as above, but with curl
:
$ curl -w "\n" -X POST http://127.0.0.1:5433/v1/marcua -H "entity-type: user"
{"entity":"marcua","entity_type":"user"}
$ curl -w "\n" -X POST http://127.0.0.1:5433/v1/marcua/test.sqlite -H "db-type: sqlite"
{"entity":"marcua","database":"test.sqlite","database_type":"sqlite"}
$ curl -w "\n" -X POST http://127.0.0.1:5433/v1/marcua/test.sqlite/query -d 'CREATE TABLE favorite_databases(name varchar, score integer);'
{"fields":[],"rows":[]}
$ curl -w "\n" -X POST http://127.0.0.1:5433/v1/marcua/test.sqlite/query -d "INSERT INTO favorite_databases (name, score) VALUES (\"PostgreSQL\", 10);"
{"fields":[],"rows":[]}
$ curl -w "\n" -X POST http://127.0.0.1:5433/v1/marcua/test.sqlite/query -d "INSERT INTO favorite_databases (name, score) VALUES (\"SQLite\", 9);"
{"fields":[],"rows":[]}
$ curl -w "\n" -X POST http://127.0.0.1:5433/v1/marcua/test.sqlite/query -d "INSERT INTO favorite_databases (name, score) VALUES (\"DuckDB\", 9);"
{"fields":[],"rows":[]}
$ curl -w "\n" -X POST http://127.0.0.1:5433/v1/marcua/test.sqlite/query -d "SELECT * FROM favorite_databases;"
{"fields":["name","score"],"rows":[["PostgreSQL","10"],["SQLite","9"],["DuckDB","9"]]}
If ayb
is successful, it will become easier to create a database, interact with it, and share it with relevant people/organizations. There are three groups that would benefit most from such a tool, and by studying the problems they face, we can make ayb
more useful for them.
Students. The barrier to learn how to work with data is too high, and much of it is in operational overhead (how to set up a database? how to connect to it? how to share what I’ve learned?). Ideally, aside from registering for an account and creating a database, there should be no operational overhead to writing your first SQL query. It should be easy to fork a data set and start asking questions, and it should be easy to start inserting rows into your own small data set. If you get stuck, it should be easy to give a mentor or teacher access to your database and get some help.
Sharers. Scientists, journalists, and other people who want to share a data set have largely ad hoc means to share that data, and their collaborators and readers’ experience is limited by the ad hoc sharing decisions. You’ve encountered this if you’ve ever tried to do something with the CSV file someone shared over email or if you’ve wanted to visualize the data presented in an article in a slightly different way. Sharers should be able to create a database, add collaborators, and eventually open it up to the public to fork/query in a read-only way with as little overhead for themselves or the recipient as possible. While this design pushes computation onto the shared instances and away from capable laptops, it enables consistency in data and allows collaborators to benefit from future updates.
Sovereigns. When you use most hosted applications, you’re not in control of your own data. Today’s application stack places ownership of the database and data with the organization that wrote the application. While this model has several benefits, it also means that your data isn’t yours, which has privacy, security, economic, and extensibility implications. The company that hosts the application has sovereignty over the database that hosts the data, and at best they allow you to export portions of your data in sometimes unhelpful formats. The most speculative use case for ayb
is that it grants end-users sovereignty over their data. Imagine a world where, before signing up for an application, you spin up an ayb
database and authorize the application to your new database. As long as you’re still getting value from an app, it can provide functionality on top of your data. If you ever change your mind about the app, the data is yours by default, and you can change who has access to your data.
Thank you for reading this far. From here, you can:
ayb
in the Roadmap.Thank you to Sofía Aritz, Meredith Blumenstock, Daniel Haas, Meelap Shah, and Eugene Wu for reading and suggesting improvements to early drafts of this blog post. Shout out to Meelap Shah and Eugene Wu for convincing me to not call this project stacks
, to Andrew Lange-Abramowitz for making the connection to the storied meme, and to Meredith Blumenstock for listening to me fret over it all.
In the data world, most reporting starts by asking how much?: “how many new customers purchase each week?” or “what is the monthly cost of medical care for this group?”
Inevitably the initial reports result in questions about why?: “why did we see less purchases last week?” and “why are the medical costs for this group increasing?”
The academic community has an answer to such why? questions: explanation algorithms. An explanation algorithm looks at columns/properties of your dataset and identifies high-likelihood explanations (called “predicates” in database-speak). For example, the algorithms might find that you got less customers in the segment of people who saw a new marketing campaign, or that the medical costs for the group you’re studying can largely be attributed to costly treatments in a subgroup.
The academic interest is founded in real pain. When a journalist, researcher, or organization asks why?, the resulting data anlysis largely goes into issuing ad hoc GROUP BY queries or unscientifically creating pivot tables to try to slice and dice datasets to explain some change in a dataset over time. Companies like Sisu (founded by Peter Bailis, one of the authors of the DIFF paper discussed below) are built on the premise that data consumers are increasingly asking why?
You can rephrase lots of different questions in the form of an explanation question. This is an area I’ve been interested in for a while, especially as it might help people like journalists and social scientists better identify interesting trends. In A data differ to help journalists (2015), I said:
It would be nice to have a utility that, given two datasets (e.g., two csv files) that are schema-aligned, returns a report of how they differ from one-another in various ways. The utility could take hints of interesting grouping or aggregate columns, or just randomly explore the pairwise combinations of (grouping, aggregate) and sort them by various measures like largest deviation from their own group/across groups.
At the time of that post, I hadn’t yet connected the dots between the desire for such a system and the active work going on in the research world. Thanks to database researchers, that connection now exists! In this post, I’ll first cover two approaches to explanation algorithms, and then introduce an open source implementation of one of them in my datools library.
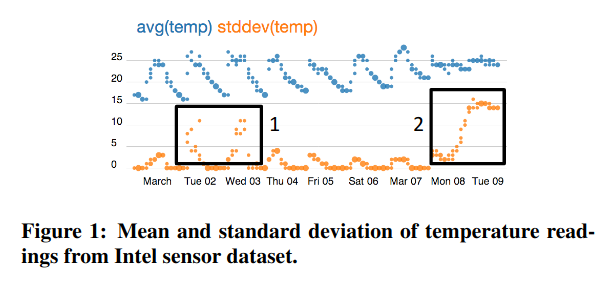
In 2013, Eugene Wu and Sam Madden introduced Scorpion, a system that explains why an aggregate (e.g., the customer count last week) is higher or lower than other example data. Figure 1 in their paper explains the problem quite nicely. They imagine a user looking at a chart, in this case of aggregate temperatures from a collection of sensors, and highlighting some outliers to ask “compared to the other points on this chart, why are these points so high?”
A figure that shows how a user might highlight outliers on a chart (source: Scorpion paper) |
Scorpion has two nice properties. First, it operates on aggregates: it’s not until you look at some weekly or monthly statistics that you notice that something is off and search for an explanation. Second, it’s performant on a pretty wide variety of aggregates, with optimizations for the most common ones (e.g., sums, averages, counts, standard deviations). I believe that of all the explanation algorithms, Scorpion pairs the most intuitive phrasing of the question (“why so high/low?”) with the most intuitive experience (highlighting questionable results on a visualization).
The challenge in implementing Scorpion is that, as presented, it does its processing outside of the database that stores the data. Specifically, the way Scorpion partitions and merges subsets of the data to identify an explanation requires decision trees and clustering algorithms that traditionally execute outside of the database1. It is also specific to aggregates, which are commonly the source of why questions, but aren’t the only places that question arises.
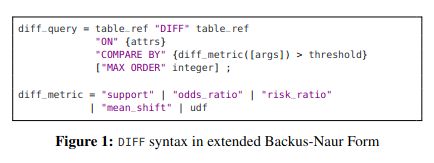
This is where DIFF comes in2. In 2019, Firas Abuzaid, Peter Kraft, Sahaana Suri, Edward Gan, Eric Xu, Atul Shenoy, Asvin Ananthanarayan, John Sheu, Erik Meijer, Xi Wu, Jeff Naughton, Peter Bailis, and Matei Zaharia introduced an explanation algorithm in the form of a database operator called DIFF that can be expressed in SQL. If you’re so inclined, here’s the syntax for the DIFF operator:
The syntax for the DIFF operator (source: DIFF paper) |
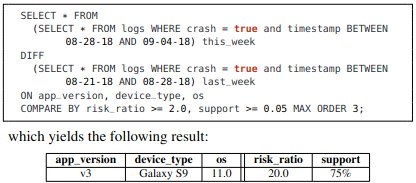
An example with SQL might help in understanding how it works:
A simple example of the DIFF operator in action (source: DIFF paper) |
In this example, the DIFF operator compares the crash logs of an application from this week to those of last week, considering columns like application version, device, and operating system for an explanation. The most likely explanation happened 20x more this week than last week (risk_ratio = 20.0
), and explains 75% of this week’s crashes (support = 75%
).
DIFF requires that we do some mental gymnastics to transform “why was X so high?” into “how are these two groups different?”. It also requires the user to wrap their head around statistics like risk ratios and support. In exchange for that mental overhead, DIFF is exciting for its praticality. As the example shows, DIFF’s authors envision it being expressed in SQL, which means it could be implemented on top of most relational databases. While a contribution of the paper is a specialized and efficient implementation of DIFF that databases don’t have today, it can also be implemented entirely in the database as a series of SQL GROUP BY/JOIN/WHERE operators.
If you have a relational database, love SQL, and want to run an explanation algorithim, DIFF is exciting because those three things are all you need. Luckily for you, dear reader, I had a relational database, loved SQL, and wanted to run an explanation algorithm.
Over the past few months, I’ve been implementing DIFF as a thin Python wrapper that generates the SQL necessary to compute the difference between two schema-aligned queries. The core of the implementation to do this, including comments, requires a little under 300 lines of code. To see a full example of the tool in action, you can check out this Jupyter Notebook, but I’ll show snippets below to give you a sense of how it works.
First, we need a dataset. For that, I took inspiration from the Scorpion paper’s experiments, one of which relied on sensor data from Intel collected by my grad school advisor Sam Madden (and a few collaborators). Using Simon Willison’s excellent sqlite-utils library, I load the data into SQLite and inspect it:
# Retrieve and slightly transform the data
wget http://db.csail.mit.edu/labdata/data.txt.gz
gunzip data.txt.gz
sed -i '1s/^/day time_of_day epoch moteid temperature humidity light voltage\n/' data.txt
head data.txt
# Get it in SQLite
pip install sqlite-utils
sqlite-utils insert intel-sensor.sqlite readings data.txt --csv --sniff --detect-types
sqlite-utils schema intel-sensor.sqlite
That last sqlite-utils schema
shows us what the newly generated readings
table looks like:
CREATE TABLE "readings" (
[day] TEXT,
[time_of_day] TEXT,
[epoch] INTEGER,
[moteid] INTEGER,
[temperature] FLOAT,
[humidity] FLOAT,
[light] FLOAT,
[voltage] FLOAT
);
OK! So we have a row for each sensor reading, with the day
and time_of_day
it happened, an epoch
to time-align readings from different sensors, a moteid
(the ID of the sensor, otherwise known as a mote), and then the types of things that sensors tend to sense: temperature
, humidity
, light
, and voltage
.
In the Scorpion paper (Sections 8.1 and 8.4), a user notices that various sensors placed throughout a lab detect too-high temperature values (reading the experiment code, this happens in the days between 2004-03-01 and 2004-03-10). A natural question is why this happened. The Scorpion algorithm discovers that moteid = 15
(a sensor with ID 15) was having a bad few days.
Can we replicate this result with DIFF? Let’s see! The DIFF implementation is part of a library I’ve been building called datools
, which is a collection of tools I use for various data analyses. Let’s install datools:
pip install datools
Now let’s use it!
from sqlalchemy import create_engine
from datools.explanations import diff
from datools.models import Column
engine = create_engine('sqlite:///intel-sensor.sqlite')
candidates = diff(
engine=engine,
test_relation='SELECT moteid, temperature, humidity, light, voltage FROM readings WHERE temperature > 100 AND day > "2004-03-01" and day < "2004-03-10"',
control_relation='SELECT moteid, temperature, humidity, light, voltage FROM readings WHERE temperature <= 100 AND day > "2004-03-01" and day < "2004-03-10"',
on_column_values={Column('moteid'),},
on_column_ranges={},
min_support=0.05,
min_risk_ratio=2.0,
max_order=1)
for candidate in candidates:
print(candidate)
What’s diff
have to say?
Explanation(predicates=(Predicate(moteid = 15),), risk_ratio=404.8320855614973)
Explanation(predicates=(Predicate(moteid = 18),), risk_ratio=200.5765335449176)
Wow! moteid = 15
is the top predicate that datools.diff
identified as being the difference between the test_relation
and control_relation
! With a risk_ratio = 404.83
, we learn that sensor 15 is about 400 times more likely to appear in the set of records with high temperature readings than in the set of records with low temperature readings. Hooray for replicating the Scorpion result! Poor sensor 15!
Let’s break that call to diff
down a bit so we understand what’s going on:
engine
: a SQLAlchemy engine that’s connected to some database, in this case the SQLite database.test_relation
: the “test set,” which is a query with records that show a particular condition. In our case, it’s the higher-temperature records during the period of interest. This could alternatively be a SQL query for “patients with high medical costs” or “customers who purchased.”control_relation
: the “control set,” which is a query with records that don’t show that particular condition. In our case, it’s the lower-temperature records during the period of interest. This could alternatively be a SQL query for “patients who don’t have high medical costs” or “leads who haven’t purchased.”on_column_values
: these are set-valued columns you want to consider as explanations. In our case, we’re considering the moteid
column, so we can identify a specific sensor thats misbehaving.on_column_ranges
: these are range-valued columns you want to consider as explanations. diff
will bucket these columns into 15 equi-sized buckets, which works well for continuous variables like {Column('humidity'), Column('light'), Column('voltage'),}
. In this example, we don’t provide any (more on why later), but in the Jupyter Notebook, you can see this in action.min_support
: The smallest fraction ([0, 1]) of the test set that the explanation should explain. For example, min_support=0.05
says that if an explanation doesn’t include at least 5% of the test set, we don’t want to know about it.min_risk_ratio
: The smallest risk ratio that the explanation should cover. For example, min_risk_ratio=2.0
says that if an explanation isn’t at least 2 times as likely to appear in the test set than in the control set, we don’t want to know about it.max_order
: How many columns to consider for a joint explanation. For example, in the Scorpion paper, the authors find that not just sensor 15 (one-column explanation), but sensor 15 under certain light and voltage conditions (three column-explanation), is the best explanation for outlier readings. To analyze three-column explanations, you’d set max_order=3
. Sadly and hopefully temporarily, while max_order
is the most fun, interesting, and challenging-to-implement parameter of the DIFF paper, datools.diff
only supports max_order=1
for now.An astute reader will note that I coaxed the results in my example a bit by asking DIFF to consider only moteid
explanations (on_column_values={Column('moteid'),}
). The Scorpion paper considers the other columns as well and still gets the strongest signal from moteid
. In the Jupyter Notebook, we dive into this more deeply and run into an issue replicating the Scorpion results with diff
. I offer some hypotheses for this in the notebook, but to have a more informed opinion, we’ll have to wait until datools.diff
supports max_order > 1
.
Before we go off and celebrate the replication of the Scorpion paper’s findings with the DIFF paper’s algorithm, you should know that it’s not all roses. Luckily, I’m just as excited about improving datools.diff
as I was when I first wrote it, so consider the list below to be both limitations of the current version and a roadmap for the library. If you’re curious, this project board tracks the things I’m working on most actively.
diff
work on more than just SQLite. diff
generates SQL, and I’d love for that SQL to run on any database. This is largely a matter of improving the test harness to provision other databases and fixing whatever breaks. The next few databases I’m targeting are DuckDB, Postgres, and Redshift, but if you’re interested in collaborating on something else, I’d love to help.max_order > 1
. One of the DIFF paper’s contributions is in how to spar with the combinatorial explosion you encounter in looking for multi-column explanations. I’d love to support at least 2- or 3-column explanations.diff
on more datasets. If you’ve got a dataset (especially a public one) you’re hoping to try this on, let me know!diff
on Scorpion’s analysis after implementing higher-order explanations. The full Jupyter Notebook shows that diff
can’t yet replicate Scorpion’s results when we ask it to consider more columns than moteid
. The notebook offers explanations ranging from “DIFF and Scorpion are different algorithms and have different tradeoffs” to “Why are we considering an output measure as an explanation?” I think it’s worth revisiting this after implementing max_order > 1
, so that we can see how datools.diff
handles more complex explanations.datools
. diff
is part of the datools
package, but I haven’t told you much about datools
. Countless words have been spilled about how SQL, despite being here to stay, also has its rough edges. datools
smooths some of these rough edges out3.Eugene Wu not only introduced me to the concept of explanation algorithms, but also patiently guided me through starts and stops as I tried to implement various papers. Peter Bailis not only showed that the need for explanation algorithms is felt broadly, but also supportively contextualized DIFF relative to even more recent state-of-the-art solutions. I’m grateful to both of them for their feedback.
Strictly speaking, it doesn’t have to be the case that more complex analytics or machine learning algorithms have to be run outside the database. MADlib speaks to this nicely, although in practice the approach hasn’t taken off as widely as I wish it did. ↩
As an example, not every database (I’m looking at you, SQLite and Redshift) supports things like grouping sets and data cubes, but these operators are critical for making tools like DIFF-in-SQL work effectively. datools
offers wrappers that, if a database supports grouping sets, will use the native functionality, but if the database doesn’t, will do the next best thing. ↩
When we moved to NYC a few years ago, I wanted to keep up with what was going on in the neighborhood, but also wanted to avoid relying on Facebook or other closed ecosystems to stay connected. Friends recommended an open forum administered and moderated by volunteers called Jackson Heights Life (and its sibling forum, Astorians). Each forum offered an RSS feed with its latest posts, which allowed me to track updates on neighborhood happenings from the comfort of my feed reader. This all worked well until the volunteers for the two forums announced that for various reasons, they were shutting the forums down with the new year.
Responses to the announcements varied, but some commenters wondered whether the forums’ contents would be preserved, as they were nearing two decades of history. My immediate thought was to check The Internet Archive, but the results weren’t promising: there were very few crawls of the website in 2021, and the ones that existed were largely of images, not forum posts. I reached out to forum moderators, and they said that they been advised about digital preservation services, but that the costs were prohibitive (>= $1,000 per forum). Nostalgia struck, and I reasoned that my trying to capture the websites in the final few days of 2021 was better than nothing.
What follows is a hopefully reproducible set of steps involving command line tools like wget
, git
, grep
, and sed
, and tools like GitHub Pages to host the archived website for free. It sadly requires some technical skills. After a few caveats, I explain the process and tools.
Before we begin, here are a few things to consider:
--adjust-extension
and --restrict-file-names=ascii,windows
and flags to wget
that I share below will also change filenames on you, so preserving old URLs is virtually impossible. This is a guide to creating an archive of the content, not a facsimile of the old website and its behavior.wget
tricks would not work.This last point is worth considering more broadly: today’s website architectures are perhaps optimized for latency or responsiveness, but not for preservation. For every walled garden or web application we encounter, how might we help its contents outlast the decades?
Here’s what you need to do to archive a website, with examples.
I do all of my development on a remote server, and have a $5/month virtual server for all of my side projects. That helps with things like leaving long-running commands to run while you sleep, but it’s not a requirement: you can run all of these commands from most laptops with access to a shell.
The first step is to crawl the website using a tool like wget
in recursive
mode. The following command (with a more aggressive wait
as the deadline approached) is the one I used:
wget -P . --recursive --page-requisites --adjust-extension --convert-links --wait=1 --random-wait --restrict-file-names=ascii,windows https://www.example.com
The wget
documentation is rich with examples and flags. I didn’t explore a bunch that might have simplified things for me like --mirror
or --backup-converted
. The forums I crawled had hundreds of thousands of pages, and all in all it took approximately a full night’s sleep to crawl each site. If you’re running this on a laptop, you’ll want to turn off automatic sleep mode (leaving yourself a reminder to bring it back when you’re done). On a remote server, don’t forget to use tmux
or screen
so your shell persists. Here are a few notes on the flags I used:
--recursive
: Keep requesting linked pages.--page-requisites
: …and their static assets (e.g., .js, .css)--adjust-extension
: Add extensions like .html
to file names that are missing it--convert-links
: Rewrite references to files so that they work locally--wait=1
: How many seconds to wait between requests so you don’t harm the server. You can adjust this depending on your deadline.--random-wait
: Introduce randomness to the wait time on the previous line, in case something on the server might prevent crawlers.--restrict-file-names=ascii,windows
: (Probably necessary, but will changefile names, breaking URLs.) I used this to convert the query string into something that wouldn’t confused browsers/servers. For example, if you’re crawling index.php?some=args
and hoping to convert that to something a web server can serve without running PHP, this flag will rewrite the path.Before mucking with the downloaded source and potentially making a mistake, put the content into source control. I used GitHub because it offers free web hosting through GitHub Pages, but you do you. Each of the forums’ hundreds of thousands of pages worked out to about ~5 gigabytes of space. Intuition and previous things people told me made me worry about storing that much stuff in Git, but I’ve seen way larger repositories in professional contexts, so I wasn’t going to worry about it if it worked. Things largely worked, but some git
operation took tens of minutes and I had to set ServerAliveInterval 60
and ServerAliveCountMax 30
in ~/.ssh/config
to avoid timing out the original git push
.
Given how slow some of the git
operations end up, you might want to make sure the crawl worked at all before your initial git add
/git commit
. To do that, jump ahead to test the website locally to make sure things look reasonable (but not perfect, yet).
Let’s host this archive for free! There are many options for doing this, from putting it up on S3/CloudFront to using Netlify or Vercel to host the static assets. I used GitHub Pages because it’s free, but I’m not here to sell you anything. Many solutions would have sufficed. Here are some notes on what I learned:
Jekyll
stuff. GitHub Pages has really nice integration with Jekyll so you can set up templates, etc., but you’ve just crawled a bunch of HTML and hope to never edit again. You can disregard this part of their documentation.https://yourname.github.io/projectname
as the URL, but you can also set up a custom CNAME. The owners the original domains were kind enough to point archive.astorians.com and archive.jacksonheightslife.com my way, which I think is a bit more fitting for an archive. They had other plans for the www
CNAMEs, so to the residents of Queens I say: get excited!After the crawl completes (and not while it’s running, since wget
’s --convert-links
runs after the crawl is done), you can run a local web server with:
timeout 2h \
python3 -m http.server \
--bind 0.0.0.0 8001
With 0.0.0.0
, you will be able to access the server remotely, and you should pick a port (8001
in the example) that’s open on the server. The timeout 2h
kills the server after 2 hours since I don’t like forgetting to leave services running on my remote server. In my case, I visited http://my.address.tld:8001
after the crawl and immediately ran into issues, which I addressed in the next step.
This is the most labor-intensive part of the process.
wget
can’t anticipate, download, or rewrite every path (in my case, some URLs were constructed in JavaScript, and static references in CSS background
s weren’t rewritten).wget
) and place them in the appropriate directory.wget
’s --convert-links
, I had ~150,000 pages for each forum with absolute URLs (or JavaScript that constructed those URLs) that I had to rewrite. Here are some handy command line tricks to help you on your journey in rewriting hundreds of thousands of files:
wget
didn’t collect, and you can describe that pattern with a regular expression, use something like grep -rho '"http://www.astorians.com/community/Theme[^\"]*"' . | sort | uniq | xargs wget -x -
to download all of the missing files. Replace the ...astorians...
path string with your regular expression.git grep -lz 'OLD_STRING_TO_REPLACE' | xargs -0 sed -i '' -e 's/OLD_STRING_TO_REPLACE/NEW_STRING_TO_USE/g'
, replacing OLD_STRING_TO_REPLACE
and NEW_STRING_TO_USE
with regular expressions for the old and new string.Having tested the websites locally and manually fixing issues, you’d think life is good. When you look at the GitHub Pages-hosted website for the first time, expect more things to break. For me, GitHub Pages used HTTPS/TLS (yay!), which prevented the browser from loading insecure http://...
static assets. Play some music and go back to the manually… step. With 10 minutes between each deploy, you’ll be here a while.
At some point, you’ll have iteratively refined your way to success. The first website refresh that looks half-decent will give you quite a thrill. You’ve preserved a bit of internet history. Go you.
Thank you to the owners, administrators, moderators, and commenters of Astorians and Jackson Heights Life. Your role was a lot more involved than mine. Thank you also to Meredith Blumenstock for reading a draft of this writeup.
]]>Much of the work a data scientist or engineer performs today is rote and error-prone. Data practitioners have to perform tens of steps in order to believe their own analyses and models. The process for each step involves modifications to hundreds/thousands of lines of copy/pasted code, making it easy to forget to tweak a parameter or default. Worse yet, because of the many dependent steps involved in a data workflow, errors compound. It’s no surprise that even after checking off every item of a good data practices checklist, the data practitioner doesn’t fully trust their own work.
Luckily, the data community has been making a lot of common operations less arcane and more repeatable. The community has been automating common procedures including data loading, exploratory data analysis, feature engineering, and model-building. This new world of autodata tools takes some agency away from practitioners in exchange for repeatability and a reduction in repetitive error-prone work. Autodata tools, when used responsibly, can standardize data workflows, improve the quality of models and reports, and save practitioners time.
Autodata doesn’t replace critical thinking: it just means that in fewer lines of code, a data practitioner can follow a best practices. Fully realized, an autodata workflow will break a high-level goal like “I want to predict X” or “I want to know why Y is so high” into a set of declarative steps (e.g., “Summarize the data,” “Build the model”) that require little or no custom code to run, but still allow for introspection and iteration.
In this post, I’ll first list some open source projects in the space of autodata, and then take a stab at what the future of autodata could look like. There’s no reason to trust the second part, but it might be fun to read nonetheless.
Here are a few trailblazing open source projects in the world of autodata, categorized by stage in the data analysis pipeline. I’m sure I’ve missed many projects, as well as entire categories in the space. The survey reflects the bias in my own default data stack, which combines the command line, Python, and SQL. This area deserves a deeper survey: I’d love to collaborate with anyone that’s compiling one.
One deliberate element of this survey is that I largely focus on tools that facilitate data tinkering rather than on how to create enterprise data pipelines. In my experience, even enterprise pipelines start with one data practitioner tinkering in an ad-hoc way before more deeply reporting and modeling, and autodata projects will likely narrow the gap between tinkering and production.
You can’t summarize or analyze your data in its raw form: you have to turn it into a data frame or SQL-queriable database. When presented with a new CSV file or collection of JSON blobs, my first reaction is to load the data into some structured data store. Most datasets are small, and many analyses start locally, so I try loading the data into a SQLite or DuckDB embedded database. This is almost always harder than it should be: the CSV file will have inconsistent string/numeric types and null values, and the JSON documents will pose additional problems around missing fields and nesting that prevents their loading into a relational database. The problem of loading a new dataset is the problem of describing and fitting it to a schema.
I’ve been intrigued by sqlite-utils, which offers CSV and JSON importers into SQLite tables. DuckDB has similar support for loading CSV files. If your data is well-structured, these tools will allow you to load your data into a SQLite/DuckDB database. Unfortunately, if your data is nested, missing fields, or otherwise irregular, these automatic loaders tend to choke.
There’s room for an open source project that takes reasonably structured data and suggests a workable schema from it1. In addition to detecting types, it should handle the occasional null value in a CSV or missing field in JSON, and should flatten nested data to better fit the relational model. Projects like genson handle schema detection but not flattening/relational transformation. Projects like visions lay a nice foundation for better detecting column types. I’m excited for projects that better tie together schema detection, flattening, transformation, and loading so that less manual processing is required.
So far, this section has assumed reasonably clean/structured data that just requires type/schema inference. Academia and industry each have quite a bit to say about data cleaning2, and there are also a few open source offerings. The OpenRefine project has been around for a while and shows promise. The dataprep project is building an API to standardize the early stages of working with new datasets, including cleaning and exploratory data analysis. Understandably, these tools rely quite heavily on a human in the loop, and I’m curious if/how open source implementations of auto-data cleaning will pop up.
When presented with a new dataset, it’s important to interrogate the data to get familiar with empty values, outliers, duplicates, variable interactions, and other limitations. Much of this work involves standard summary statistics and charts, and much of it can be automated. Looking at the data you’ve loaded before trying to use it is important, but wasting your time looping over variables and futzing with plotting libraries is not.
The pandas-profiling library will take a pandas data frame and automatically summarize it. Specifically, it generates an interactive set of per-column summary statistics and plots, raise warnings on missing/duplicate values, and identify useful interaction/correlation analyses (see an example to understand what it can do). Whereas pandas-profiling
is geared toward helping you get a high-level sense of your data, the dabl project has more of a bias toward analysis that will help you build a model. It will automatically provide plots to identify the impact of various variables, show you how those variables interact, and give you a sense of how separable the data is.
To build predictive models over your data, you have to engineer features for those models. For example, for your model to identify Saturdays as a predictor of poor sales, someone has to extract a day_of_the_week
feature from the purchase_datetime
column. In my experience, a ton of data engineering time goes into feature engineering, and most of that work could be aided by machines. Data engineers spend lots of time one hot encoding their categorical variables, extracting features from datetime fields, vectorizing text blobs, and rolling up statistics on related entities. Feature engineering is further complicated by the fact that you can take it too far: because of the curse of dimensionality, you should derive as many details as possible from the dataset, but not create so many features that they rival the size of your dataset. Often, engineers have to whittle their hard-earned features down once they realize they’ve created too many.
I’m heartened to see automatic feature engineering tools like featuretools for relational data and tsfresh for time series data. To the extent that engineers can use these libraries to automatically generate the traditional set of features from their base dataset, we’ll save days to weeks of work building each model. There’s room for more work here: much of the focus of existing open source libraries has been about automatically creating new features (increasing dimensionality) and not enough has been on identifying how many features to create (preserving model simplicity).
A project like scikit-learn offers so many models, parameters, and pipelines to tune when building a classification or regression model. In practice, every use I’ve seen of scikit-learn
has wrapped those primitives in a grid/random search of a large number of models and a large number of parameters. Data practitioners have their go-to copy-pastable templates for running cross validated grid search across the eye-numbing number of variables that parameterize your favorite boosted or bagged collection of trees. Running the search is pretty mindless and not always informed by some deep understanding of the underlying data or search space. I’ve seen engineers spend weeks running model searches to eke out a not-so-meaningful improvement to an F-score, and would have gladly opted for a tool to help us arrive at a reasonable model faster.
Luckily, AutoML projects like auto-sklearn aim to abstract away model search: given a feature-engineered dataset, a desired outcome variable, and a time budget, auto-sklearn
will emit a reasonable ensemble in ~10 lines of code. The dabl project also offers up the notion of a small amount of code for a reasonable baseline model. Whereas auto-sklearn
asks the question “How much compute time are you willing to exchange for accuracy?” dabl
asks “How quickly can you understand what a reasonable model can accomplish?”
The sections above present data problems as one-time problems. In practice, much of the work described above is repeated as new data and new questions arise. If you transformed your data once to ingest or feature engineer it, how can you do repeat that transformation each time you get a new data dump? If you felt certain in the limitations of the data the first time you analyzed it, how can you remain certain as new records arrive? When you revisit a report or model to update it with new data or test a new hypothesis, how can you remember the process you used to arrive at the report or model last time?
There are solutions to many of these problems of longevity. dbt helps you create repeatable transformations so that the data loading workflow you created on your original dataset can be applied as new records and updates arrive. great_expectations helps you assert facts about your data (e.g., unique columns, maximum values) that should be enforced across updates, and offers experimental functionality to automatically profile and propose such assertions.
Whereas the open source world has good answers to repeatable data transformation and data testing, I haven’t been able to find open source tools to track and make repeatable all of the conditions that let to a trained model. There are a few companies in the space3, and I hope that open source offerings arise.
Autodata is in its infancy: some of the projects listed above aren’t yet at 1.0 versions. What could the future of autodata look like? While I have no track record of predicting the future, here are a few phases we might encounter.
At the moment, autodata projects exist, but aren’t data practitioners’ go-to tools. The tools that do exist focus on primitives: today’s autodata projects look at a single part of the data pipeline like schema inference or hyperparameter selection and show that it can be automated with little loss of performance/accuracy. For the foreseeable future, practitioners will still rely on their existing pipelines, but plug a promising project into their data pipeline here or there to save time.
As the automatable primitives are ironed out, more of the projects will be strung together to form pipelines that rely on multiple autodata components. For example, if sqlite-utils
used a state-of-the-art schema detection library, “define the schema and load my data” might simply turn into “load my data.” Similarly, if AutoML projects relied on best-of-class automatic feature engineering libraries, feature engineering as an explicit step might be eliminated in some cases.
As higher-level autodata abstractions mature, data pipelines will become accessible to a wider audience. This is a double-edged sword: despite the fact that working with data today requires somewhat arcane knowledge, practitioners still misuse models and misunderstand analyses. As autodata expands the number of people who can create their own data pipelines, communicating the misappropriation of autodata will be critical.
Sociotechnical researchers in areas like Ethical AI are already sounding the alarm on the hidden costs of unwavering faith in algorithms. A big research focus in the next phase of autodata will revolve around how to communicate these exceptions and limitations in software. If a pipeline had to omit part of a dataset in order to load the rest, the desire for auto (“the data was loaded! forget the details!”) will be at odds with the desire for data (“the 1% of data you didn’t load introduced a systemic bias in the model you built!”). If an autodata system selects a more complex model because it improves precision by 5%, how can that same system later warn you that the model has not continued to perform in the face of new data? A few specific areas of research will be critical here:
As autodata pipelines and abstractions mature, their interfaces can become more declarative. This will allow us to ask higher-level questions. For example, work like Scorpion and Sisu help produce hypotheses to questions like “what might have caused this variable to change?”
When declarative autodata is fully realized, you will be able to start with semi-structured data (e.g., CSVs of coded medical procedure and cost information, or customer fact and event tables), and ask a question of that data (e.g., “Why might bills be getting more expensive?” or “What is this customer’s likelihood to churn?”). Aside from how you ask the question and receive the answer, you might largely leave the system to take care of the messy details. If you’re lucky, the system will even tell you whether you can trust those answers today, and whether a consumer can trust those answers a few years down the road.
Thank you to Peter Bailis, Lydia Gu, Daniel Haas, and Eugene Wu for their suggestions on improving a draft of this post. The first version they read was an unstructured mess of ideas, and they added structure, clarity, and a few missing reference. I’m particularly grateful for the level of detail of their feedback: I wasn’t expecting so much care from such busy people!
In terms of papers, Sato offers some thoughts on how to detect types and the Section 4.3 of the Snowflake paper speaks nicely to a gradual method for determining the structure of a blob. ↩
As a taste of the work in this space, companies like Trifacta and research on projects like Wrangler have shown us what’s possible. ↩
See CometML, Determined AI, and Weights & Biases. ↩
I did a mix of reading and listening to books, largely listening to one while I ran and did chores, and reading one at night and on weekends. Libby/your library probably give you access to a bunch of e-books and audiobooks, so give both a shot!
Here are the books I read or listened to in 2019 in the order that I consumed them. After a few warmup/fun books, I started reading books from the Pulitzer prize list for previous years in a bunch of the book subcategories, as well as recommendations from friends.
Here are the books I read or listened to in 2020 in the order that I consumed them:
This was my first use of Jupyter notebooks to write a data analysis piece. It was a lot of fun, and I hope all of you do it too!
Some fun findings: 1) two 115-year-old active voters, and 2) an example of how a campaign can create a call/mailing list of active voters to ask them for additional help.
Thanks to Meredith Blumenstock and Derek Willis for reading an early draft of this!
]]>The book, which is freely available as a PDF, has two parts. In the first half, we review the state of academic research in crowdsourcing, with a special eye for data processing. The first half was a natural follow-on to our research in grad school. The second half of the book features summaries of 13 interviews with industry users of crowd work and 4 operators of crowdsourcing marketplaces. This half is filled with summary statistics and rich quotes from folks at companies like Google, Facebook, and Microsoft on how they manage large crowd workforces, what their use cases are, which aspects of the research literature they benefit from, and where they could use a little more help from researchers.
I really enjoyed two aspects of working on this book. First, it was wonderful to work with Aditya, who I never got to collaborate with in grad school. Second, the experience opened Aditya and me up to just how much you can learn from qualitative work like the interviews and surveys in the second part of the book. Both of us felt that this second lesson would have a lasting impact on how we approach learning a new topic, and how to keep industry and academia in sync on the most important problems in a field.
My only regret with the book as that, due to the formatting guidelines of our publisher, the Acknowledgements section is at the end of the book. One of my not-so-secret delights is reading the acknowledgements that people put in their Ph.D. theses, and I like it when they can be front and center. Nonetheless, it’s there, and I’m grateful!
To make the book more accessible, we’ll be putting together summaries of our favorite sections as blog posts. You can read the first one on Aditya’s blog.
]]>While we primarily used Argonaut for structured data extraction, Argonaut’s concepts can be applied to other areas of complex crowd work. It’s amazing to think our learnings come from over half a million hours of worker contributions. Without them, none of these learnings would be possible.
As a sneak peak, I’ll highlight a few fun learnings we report on in more detail in the paper. I’ll also editorialize a bit on what I think the findings mean for crowd work, especially as people do more interesting and complex things with it. Here’s the scoop:
Complex work. Traditionally in crowd work, we’re told to design microtasks: simple yes/no or multiple choice questions that are well defined. You can imagine this is pretty dehumanizing and not inspiring to workers. With the Argonaut model, we send large, meaty tasks to workers. Tasks might take upward of an hour to complete, and are generally easier to design since there’s no microtask decomposition to think about. They are closer to what you’d imagine knowledge work being like: we trust humans to do what they’re good at on challenging tasks.
Review, don’t repeat. To avoid workers making mistakes in traditional microtask work, we send multiple workers each task, and use voting-based schemes (like majority vote or expectation maximization) to identify the correct answer. With Argonaut, we do something different: only one worker completes each complex task. Entry-level workers are sometimes reviewed by trusted ones, which allows us to catch mistakes, and also allows us to send tasks back to workers so that they can correct them and learn by example. In the paper we show that review works: a large majority of tasks that are reviewed end up of higher quality, and workers get to see how to improve their own work, unlike the opaque voting-based schemes of the microtask world.
Spotcheck with help from models. The technical heart of the Argonaut paper is a TaskGrader model. We built a regression on a few hundred features of each task, like the worker’s previous work history, the length of the task, the time of day in the worker’s timezone, etc. The regression predicted, based on these features, how much a review might change/improve a worker’s work. Given a fixed budget for review or a fixed number of reviewers, we can now identify which tasks the reviewers should look at for maximal task quality improvement. In the paper, we find that for a practical review budget, you can catch around 50% more errors with the same amount of review, just by pointing reviewers at the tasks that will benefit most from their attention.
Optimizing for longevity and upward mobility changes everything. One topic/hypothesis that doesn’t receive enough attention in the paper is that having long-term relationships with crowd workers changes everything. Half of the crowd workers contributed to our system for more than 2.5 years. The ones that performed the best ended up being promoted to reviewer status, and were selected to do more interesting work when it came up. This had pretty drastic effects on our worker and task models. Hidden in Figure 7 of the paper is a neat finding: almost the entirety of the predictive power of the TaskGrader comes from task-specific features. Worker-specific features on their own don’t appear to be too predictive: by the time you establish long-term relationships with workers, the discerning properties of a task’s quality are not the trusted people you’re working with, but the difficulty of the task they are completing. This is in stark contrast to traditional microtask crowd work, where the most celebrated work quality algorithms identify the trusted workers and weigh their responses more heavily.
While this paper brings us to the tip of the iceberg of complex work and hierarchical machine-mediated review, there are a ton of questions we have yet to answer. Most important to me are questions around just how complex of work we can do with these models. Can we support high-quality creative and analytical tasks beyond structured data extraction? How generalizable is the TaskGrader to other tasks? Finally, what does it mean for crowd work if longevity and upward mobility matter as much as they do in traditional employment scenarios?
]]>It would be nice to have a utility that, given two datasets (e.g., two csv files) that are schema-aligned, returns a report of how they differ from one-another in various ways. The utility could take hints of interesting grouping or aggregate columns, or just randomly explore the pairwise combinations of (grouping, aggregate) and sort them by various measures like largest deviation from their own group/across groups.
There are a few challenges with the “just show me interesting combinations” version of this:
update with related work: