Data diffs: Algorithms for explaining what changed in a dataset
tl;dr: part 1 explains what an explanation algorithm is, and part 2 describes an open source SQL data differ.
“Why did this happen?” “What changed?”
In the data world, most reporting starts by asking how much?: “how many new customers purchase each week?” or “what is the monthly cost of medical care for this group?”
Inevitably the initial reports result in questions about why?: “why did we see less purchases last week?” and “why are the medical costs for this group increasing?”
The academic community has an answer to such why? questions: explanation algorithms. An explanation algorithm looks at columns/properties of your dataset and identifies high-likelihood explanations (called “predicates” in database-speak). For example, the algorithms might find that you got less customers in the segment of people who saw a new marketing campaign, or that the medical costs for the group you’re studying can largely be attributed to costly treatments in a subgroup.
The academic interest is founded in real pain. When a journalist, researcher, or organization asks why?, the resulting data anlysis largely goes into issuing ad hoc GROUP BY queries or unscientifically creating pivot tables to try to slice and dice datasets to explain some change in a dataset over time. Companies like Sisu (founded by Peter Bailis, one of the authors of the DIFF paper discussed below) are built on the premise that data consumers are increasingly asking why?
You can rephrase lots of different questions in the form of an explanation question. This is an area I’ve been interested in for a while, especially as it might help people like journalists and social scientists better identify interesting trends. In A data differ to help journalists (2015), I said:
It would be nice to have a utility that, given two datasets (e.g., two csv files) that are schema-aligned, returns a report of how they differ from one-another in various ways. The utility could take hints of interesting grouping or aggregate columns, or just randomly explore the pairwise combinations of (grouping, aggregate) and sort them by various measures like largest deviation from their own group/across groups.
At the time of that post, I hadn’t yet connected the dots between the desire for such a system and the active work going on in the research world. Thanks to database researchers, that connection now exists! In this post, I’ll first cover two approaches to explanation algorithms, and then introduce an open source implementation of one of them in my datools library.
Two ways to ask for explanations
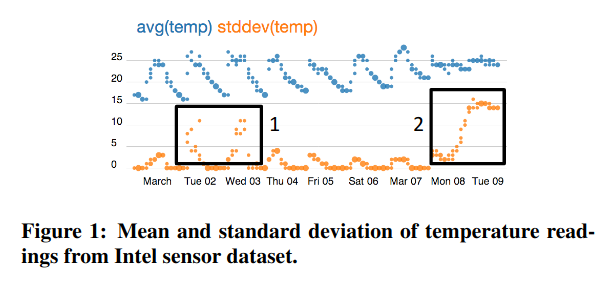
In 2013, Eugene Wu and Sam Madden introduced Scorpion, a system that explains why an aggregate (e.g., the customer count last week) is higher or lower than other example data. Figure 1 in their paper explains the problem quite nicely. They imagine a user looking at a chart, in this case of aggregate temperatures from a collection of sensors, and highlighting some outliers to ask “compared to the other points on this chart, why are these points so high?”
 |
|---|
| A figure that shows how a user might highlight outliers on a chart (source: Scorpion paper) |
Scorpion has two nice properties. First, it operates on aggregates: it’s not until you look at some weekly or monthly statistics that you notice that something is off and search for an explanation. Second, it’s performant on a pretty wide variety of aggregates, with optimizations for the most common ones (e.g., sums, averages, counts, standard deviations). I believe that of all the explanation algorithms, Scorpion pairs the most intuitive phrasing of the question (“why so high/low?”) with the most intuitive experience (highlighting questionable results on a visualization).
The challenge in implementing Scorpion is that, as presented, it does its processing outside of the database that stores the data. Specifically, the way Scorpion partitions and merges subsets of the data to identify an explanation requires decision trees and clustering algorithms that traditionally execute outside of the database1. It is also specific to aggregates, which are commonly the source of why questions, but aren’t the only places that question arises.
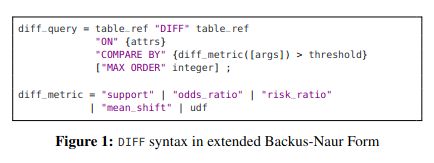
This is where DIFF comes in2. In 2019, Firas Abuzaid, Peter Kraft, Sahaana Suri, Edward Gan, Eric Xu, Atul Shenoy, Asvin Ananthanarayan, John Sheu, Erik Meijer, Xi Wu, Jeff Naughton, Peter Bailis, and Matei Zaharia introduced an explanation algorithm in the form of a database operator called DIFF that can be expressed in SQL. If you’re so inclined, here’s the syntax for the DIFF operator:
 |
|---|
| The syntax for the DIFF operator (source: DIFF paper) |
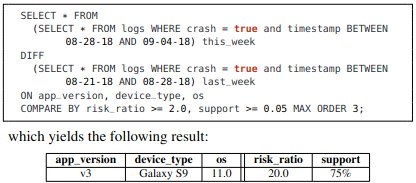
An example with SQL might help in understanding how it works:
 |
|---|
| A simple example of the DIFF operator in action (source: DIFF paper) |
In this example, the DIFF operator compares the crash logs of an application from this week to those of last week, considering columns like application version, device, and operating system for an explanation. The most likely explanation happened 20x more this week than last week (risk_ratio = 20.0), and explains 75% of this week’s crashes (support = 75%).
DIFF requires that we do some mental gymnastics to transform “why was X so high?” into “how are these two groups different?”. It also requires the user to wrap their head around statistics like risk ratios and support. In exchange for that mental overhead, DIFF is exciting for its praticality. As the example shows, DIFF’s authors envision it being expressed in SQL, which means it could be implemented on top of most relational databases. While a contribution of the paper is a specialized and efficient implementation of DIFF that databases don’t have today, it can also be implemented entirely in the database as a series of SQL GROUP BY/JOIN/WHERE operators.
If you have a relational database, love SQL, and want to run an explanation algorithim, DIFF is exciting because those three things are all you need. Luckily for you, dear reader, I had a relational database, loved SQL, and wanted to run an explanation algorithm.
An open source implementation of DIFF
Over the past few months, I’ve been implementing DIFF as a thin Python wrapper that generates the SQL necessary to compute the difference between two schema-aligned queries. The core of the implementation to do this, including comments, requires a little under 300 lines of code. To see a full example of the tool in action, you can check out this Jupyter Notebook, but I’ll show snippets below to give you a sense of how it works.
First, we need a dataset. For that, I took inspiration from the Scorpion paper’s experiments, one of which relied on sensor data from Intel collected by my grad school advisor Sam Madden (and a few collaborators). Using Simon Willison’s excellent sqlite-utils library, I load the data into SQLite and inspect it:
# Retrieve and slightly transform the data
wget http://db.csail.mit.edu/labdata/data.txt.gz
gunzip data.txt.gz
sed -i '1s/^/day time_of_day epoch moteid temperature humidity light voltage\n/' data.txt
head data.txt

# Get it in SQLite
pip install sqlite-utils
sqlite-utils insert intel-sensor.sqlite readings data.txt --csv --sniff --detect-types
sqlite-utils schema intel-sensor.sqlite
That last sqlite-utils schema shows us what the newly generated readings table looks like:
CREATE TABLE "readings" (
   [day] TEXT,
   [time_of_day] TEXT,
   [epoch] INTEGER,
   [moteid] INTEGER,
   [temperature] FLOAT,
   [humidity] FLOAT,
   [light] FLOAT,
   [voltage] FLOAT
);
OK! So we have a row for each sensor reading, with the day and time_of_day it happened, an epoch to time-align readings from different sensors, a moteid (the ID of the sensor, otherwise known as a mote), and then the types of things that sensors tend to sense: temperature, humidity, light, and voltage.
In the Scorpion paper (Sections 8.1 and 8.4), a user notices that various sensors placed throughout a lab detect too-high temperature values (reading the experiment code, this happens in the days between 2004-03-01 and 2004-03-10). A natural question is why this happened. The Scorpion algorithm discovers that moteid = 15 (a sensor with ID 15) was having a bad few days.
Can we replicate this result with DIFF? Let’s see! The DIFF implementation is part of a library I’ve been building called datools, which is a collection of tools I use for various data analyses. Let’s install datools:
pip install datools
Now let’s use it!
from sqlalchemy import create_engine
from datools.explanations import diff
from datools.models import Column

engine = create_engine('sqlite:///intel-sensor.sqlite')

candidates = diff(
        engine=engine,
        test_relation='SELECT moteid, temperature, humidity, light, voltage FROM readings WHERE temperature > 100 AND day > "2004-03-01" and day < "2004-03-10"',
        control_relation='SELECT moteid, temperature, humidity, light, voltage FROM readings WHERE temperature <= 100 AND day > "2004-03-01" and day < "2004-03-10"',
        on_column_values={Column('moteid'),},
        on_column_ranges={},
        min_support=0.05,
        min_risk_ratio=2.0,
        max_order=1)
for candidate in candidates:
    print(candidate)
What’s diff have to say?
Explanation(predicates=(Predicate(moteid = 15),), risk_ratio=404.8320855614973)
Explanation(predicates=(Predicate(moteid = 18),), risk_ratio=200.5765335449176)
Wow! moteid = 15 is the top predicate that datools.diff identified as being the difference between the test_relation and control_relation! With a risk_ratio = 404.83, we learn that sensor 15 is about 400 times more likely to appear in the set of records with high temperature readings than in the set of records with low temperature readings. Hooray for replicating the Scorpion result! Poor sensor 15!
Let’s break that call to diff down a bit so we understand what’s going on:
engine: a SQLAlchemy engine that’s connected to some database, in this case the SQLite database.test_relation: the “test set,” which is a query with records that show a particular condition. In our case, it’s the higher-temperature records during the period of interest. This could alternatively be a SQL query for “patients with high medical costs” or “customers who purchased.”control_relation: the “control set,” which is a query with records that don’t show that particular condition. In our case, it’s the lower-temperature records during the period of interest. This could alternatively be a SQL query for “patients who don’t have high medical costs” or “leads who haven’t purchased.”on_column_values: these are set-valued columns you want to consider as explanations. In our case, we’re considering themoteidcolumn, so we can identify a specific sensor thats misbehaving.on_column_ranges: these are range-valued columns you want to consider as explanations.diffwill bucket these columns into 15 equi-sized buckets, which works well for continuous variables like{Column('humidity'), Column('light'), Column('voltage'),}. In this example, we don’t provide any (more on why later), but in the Jupyter Notebook, you can see this in action.min_support: The smallest fraction ([0, 1]) of the test set that the explanation should explain. For example,min_support=0.05says that if an explanation doesn’t include at least 5% of the test set, we don’t want to know about it.min_risk_ratio: The smallest risk ratio that the explanation should cover. For example,min_risk_ratio=2.0says that if an explanation isn’t at least 2 times as likely to appear in the test set than in the control set, we don’t want to know about it.max_order: How many columns to consider for a joint explanation. For example, in the Scorpion paper, the authors find that not just sensor 15 (one-column explanation), but sensor 15 under certain light and voltage conditions (three column-explanation), is the best explanation for outlier readings. To analyze three-column explanations, you’d setmax_order=3. Sadly and hopefully temporarily, whilemax_orderis the most fun, interesting, and challenging-to-implement parameter of the DIFF paper,datools.diffonly supportsmax_order=1for now.
An astute reader will note that I coaxed the results in my example a bit by asking DIFF to consider only moteid explanations (on_column_values={Column('moteid'),}). The Scorpion paper considers the other columns as well and still gets the strongest signal from moteid. In the Jupyter Notebook, we dive into this more deeply and run into an issue replicating the Scorpion results with diff. I offer some hypotheses for this in the notebook, but to have a more informed opinion, we’ll have to wait until datools.diff supports max_order > 1.
Where to go from here?
Before we go off and celebrate the replication of the Scorpion paper’s findings with the DIFF paper’s algorithm, you should know that it’s not all roses. Luckily, I’m just as excited about improving datools.diff as I was when I first wrote it, so consider the list below to be both limitations of the current version and a roadmap for the library. If you’re curious, this project board tracks the things I’m working on most actively.
- Make
diffwork on more than just SQLite.diffgenerates SQL, and I’d love for that SQL to run on any database. This is largely a matter of improving the test harness to provision other databases and fixing whatever breaks. The next few databases I’m targeting are DuckDB, Postgres, and Redshift, but if you’re interested in collaborating on something else, I’d love to help. - Support
max_order > 1. One of the DIFF paper’s contributions is in how to spar with the combinatorial explosion you encounter in looking for multi-column explanations. I’d love to support at least 2- or 3-column explanations. - Use
diffon more datasets. If you’ve got a dataset (especially a public one) you’re hoping to try this on, let me know! - Replicate
diffon Scorpion’s analysis after implementing higher-order explanations. The full Jupyter Notebook shows thatdiffcan’t yet replicate Scorpion’s results when we ask it to consider more columns thanmoteid. The notebook offers explanations ranging from “DIFF and Scorpion are different algorithms and have different tradeoffs” to “Why are we considering an output measure as an explanation?” I think it’s worth revisiting this after implementingmax_order > 1, so that we can see howdatools.diffhandles more complex explanations. - Share more about
datools.diffis part of thedatoolspackage, but I haven’t told you much aboutdatools. Countless words have been spilled about how SQL, despite being here to stay, also has its rough edges.datoolssmooths some of these rough edges out3.
Thank you
Eugene Wu not only introduced me to the concept of explanation algorithms, but also patiently guided me through starts and stops as I tried to implement various papers. Peter Bailis not only showed that the need for explanation algorithms is felt broadly, but also supportively contextualized DIFF relative to even more recent state-of-the-art solutions. I’m grateful to both of them for their feedback.
Footnotes
-
Strictly speaking, it doesn’t have to be the case that more complex analytics or machine learning algorithms have to be run outside the database. MADlib speaks to this nicely, although in practice the approach hasn’t taken off as widely as I wish it did. ↩
-
As an example, not every database (I’m looking at you, SQLite and Redshift) supports things like grouping sets and data cubes, but these operators are critical for making tools like DIFF-in-SQL work effectively.
datoolsoffers wrappers that, if a database supports grouping sets, will use the native functionality, but if the database doesn’t, will do the next best thing. ↩