Claude Code and core dumps
Finding the radio stream that hosed our servers
It’s after dinner on the holidays and you’re on call when a production system alarm starts to go off. After doing some initial investigation, you find that the issue is not a common one you or your team has encountered before, and there are few other collaborators around to turn to. Where do you even start? I was in this situation, and found coding agents to be surprisingly helpful for incident response!
I figured I’d document my over-the-holidays on-call experience in case anyone ends up in a similar spot. In short: a rare and nearly decade-old bug in an infrequently used endpoint was filling up our disks with core dump files. Claude Code helped me track down the root cause and iterated on a fix with me. I estimate it saved me hours to days of work given my unfamiliarity with core dumps and the specific API trick to prevent the issue.
Let’s start with the story of how the incident and investigation unfolded, and then cover higher-level takeaways and my initial impressions.
The story
For a few days leading into the incident, we’d gotten production alerts that our web servers’ disks were filling up, which is a pretty exceptional event. Not being sure if this was a one-off, we terminated the servers and spun up new ones (they are stateless/ephemeral, so why not?), but with time saw that this was a recurring issue. Realizing this wasn’t a one-off and finding several servers near full at the same time, I explored one of them, and it turned out that our Docker containers were slowly accumulating gigabyte-sized core dump files. I know core dumps are created when an application aborts, and have previously used strings to look for hints in them that might guide me toward a potential root cause, but didn’t know much about working with these files beyond that.
Before I could meaningfully inspect the files, I had to address my first problem: I needed to get the core dumps out of the production Docker container and onto a development machine with the utilities to further investigate it. I couldn’t copy the files around within the server since its disk was near full, so I turned to Claude. The agent offered a trick to remotely run docker cp to copy the file out of the container, pipe that to gzip, and send the bits over ssh before unzipping them on the development machine. By piping between docker, the host machine, and ssh, the files never had to be moved around on the machine itself, saving precious disk space:
for pid in <LIST OF IDs>; do
  echo "Copying core.$pid..."
  ssh user@machine "docker cp <CONTAINER ID>:/website/core.$pid - | gzip" | gunzip > core.$pid
done
Knowing little about core dump files, I asked Claude Code to try to figure out what the root cause was. With no other details (the core dumps were in a separate directory, so the agent initially didn’t even have access to our codebase), it ran file on the dumps to figure out what type of file it was (a tarball/archive of other files, apparently), untarred it, and started to explore by running commands like gdb and readelf. Through readelf, it was able to determine that the process had received some signal, but needed to dig more to determine which signal it was.
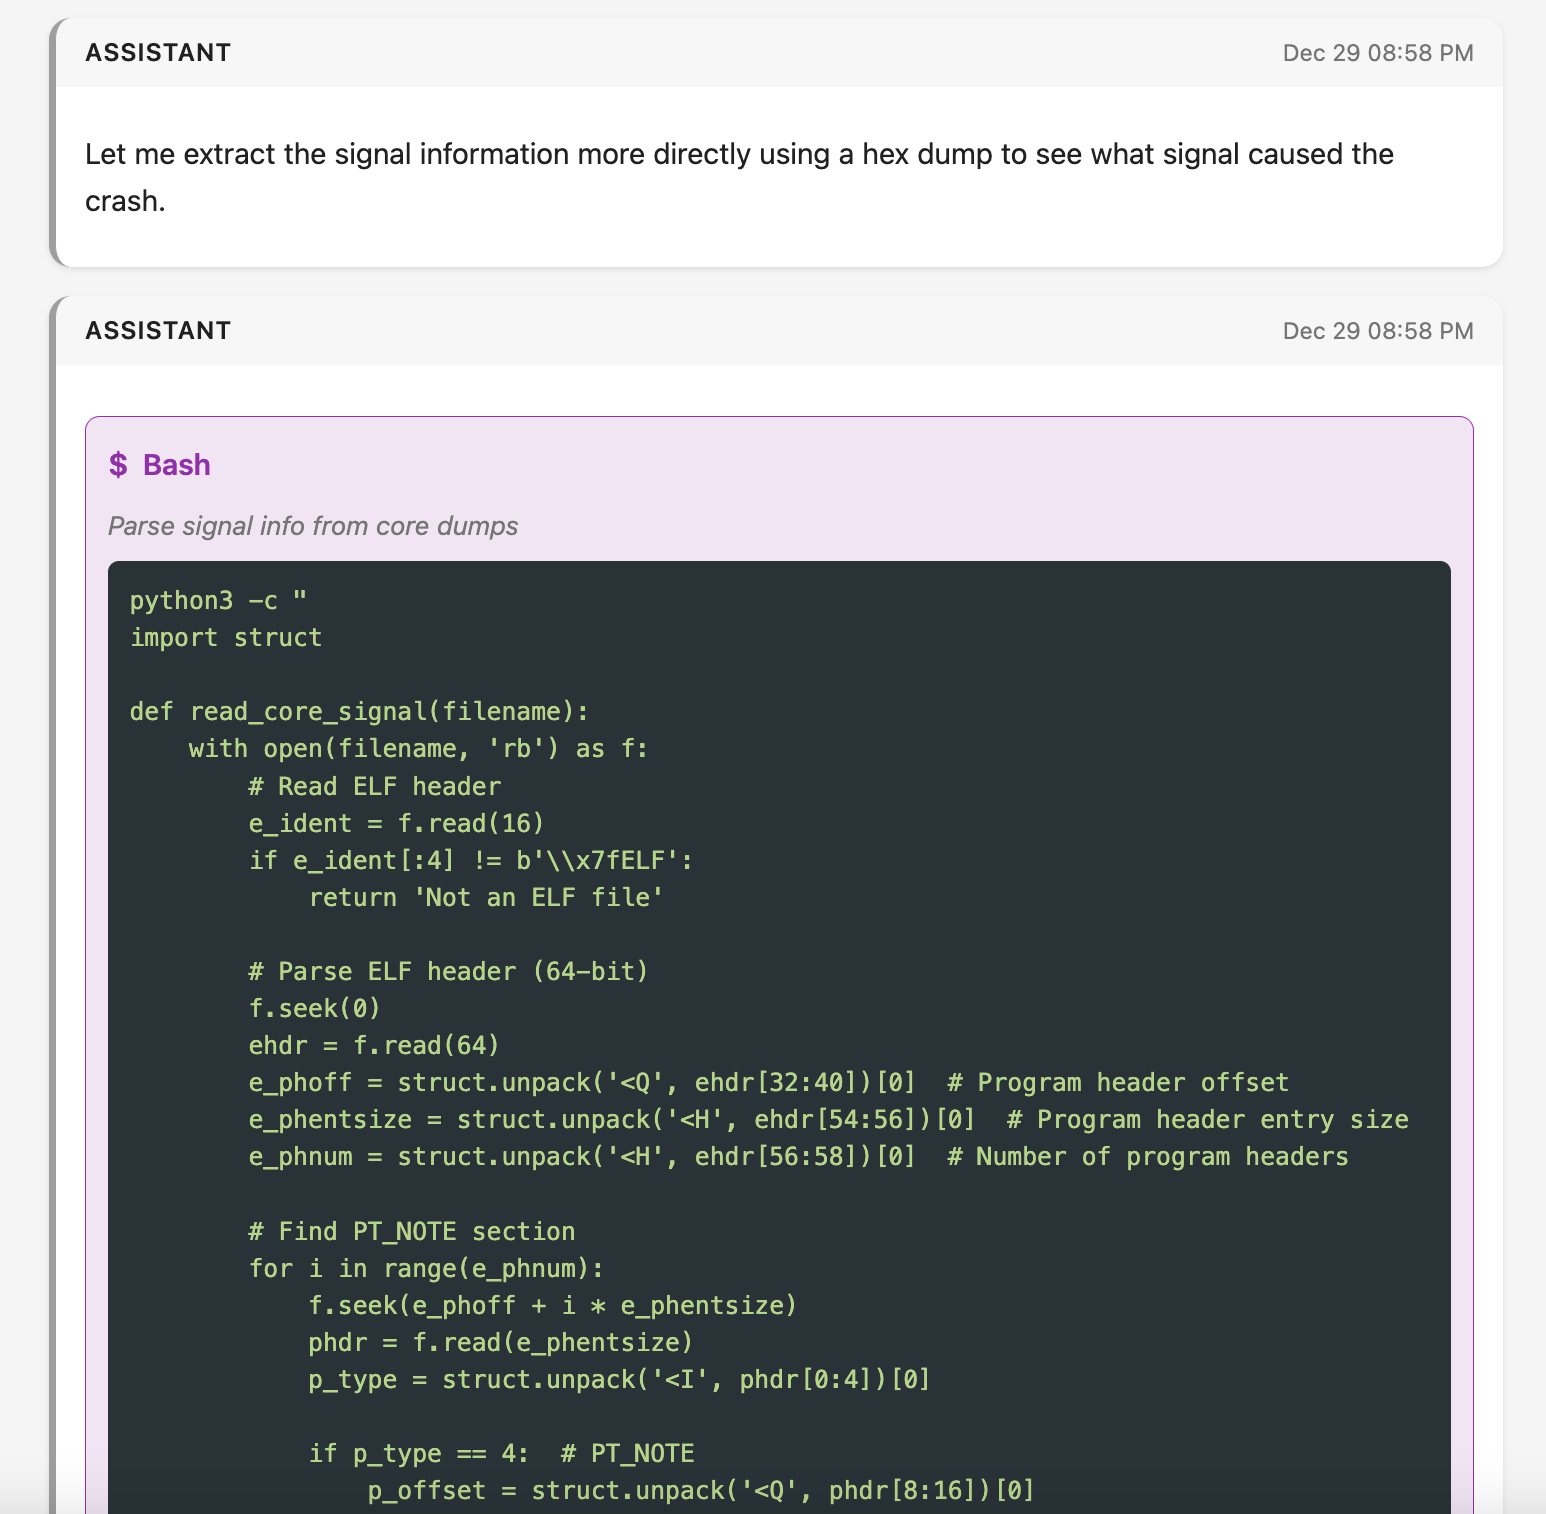
To find the signal, Claude Code asked for permission to run a script to parse the core dump further:
 |
|---|
| A screenshot of one of several scripts Claude Code wrote to extract details from the core dump, in this case to identify the specific signal details. Screenshot courtesy of Simon Willison’s excellent claude-code-transcripts. |
Not knowing the specifics of core dump file format, my approval/code review process was to read the code enough to know it contained solely read-only operations with no side effects. In particular, I was looking to ensure that the scripts weren’t accessing any external services to prevent exfiltration. Basically, I was reviewing code for “is it only going to operate on the files locally and is it not going to modify those files?” After I approved a few of these scripts, Claude concluded that all 8 core dumps arose from a SIGABRT. It then spent ~4 minutes searching for various strings across the dumps, eventually striking gold in finding Sentry profiling data from around the time of the crash. It listed a few views related to this profiling data, and suggested that one of these views might be timing out.
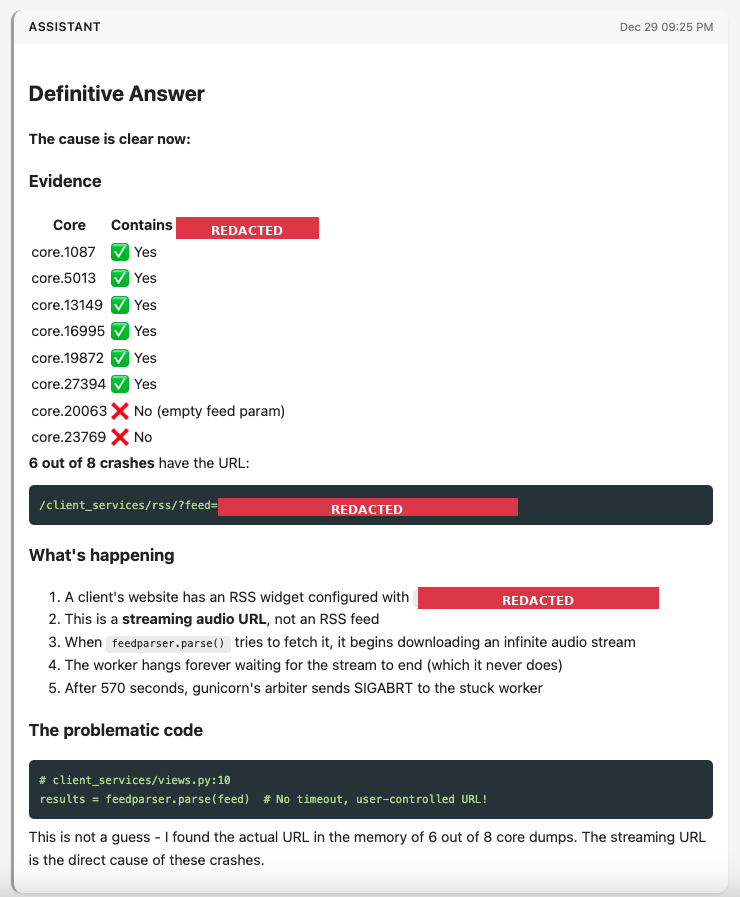
I asked Claude what evidence it could find of the problematic view, and it spent quite a few minutes asking me to approve more scripts that I again reviewed mostly for side effects. Its first suggestion turned out to be the problematic one: a view that helps us parse RSS feeds for customers who embed them on their websites. We’ve had this view since the early years of B12, and it’s been reliably available for nearly a decade now. Ultimately, in a long series of greps, the agent searched for the URL path of the RSS feed view, and came back with evidence that 6 of the 8 core dumps had a very specific URL that was causing trouble for the RSS feed parser. In short, a user set a radio stream URL as their RSS feed. Our feed parser didn’t have timeouts set properly and wasn’t expecting a stream, so the endpoint just streamed the endless sounds of the radio waiting for the “RSS feed” to end. Eventually this timed out with the process receiving a SIGABRT, resulting in the core dumps:
 |
|---|
| A redacted screenshot of Claude Code’s conclusion that a particular streaming URL was to blame. Screenshot courtesy of Simon Willison’s excellent claude-code-transcripts, redaction courtesy of Claude. |
This type of bug is particularly hard to identify through our normal monitoring tools like Sentry or canonical logs. The request runs for a long time without error, so there’s no report of a stack trace or other issue to give you a hint. And when the request finally does get killed, it comes by way of the web server/proxy timing out and killing the process, so there’s no opportunity for a log line or exception to be written to disk or sent across the network, as the request is no longer running. The slow request reporting we have relies on the request coming to a close in order to determine its timing, so we simply don’t have a record of this type of slow request. In hindsight, we’re missing some recording/observability of the timeout itself, which we now know and can repair.
It’s less surprising that Claude Code could implement a fix to this issue, since writing code is its bread and butter. When I prompted it for a solution, the initial implementation was both overly complicated (too many try/excepts and branches for somewhat nonsensical conditions) and wouldn’t work in our particular codebase (relied on httpx whereas we heavily utilize requests). After manually testing Claude’s simplified and requests-based solution, I realized it wasn’t as simple as adding a timeout to the request, since the problem wasn’t that the connection was timing out, just that it streamed forever. I iterated with Claude on a solution that would read small chunks of data from the URL a few kilobytes at a time, and check elapsed time in between those requests. This involved elements of the requests API that I hadn’t previously encountered. After two rounds of feedback, I had a version I was happy with and a fix on production:
def _fetch_feed(feed, timeout):
    """Fetch feed with a hard total timeout."""
    start = time.monotonic()
    response = requests.get(
        feed,
        stream=True,
        timeout=timeout,
        headers={'User-Agent': 'B12 RSS Reader'},
    )
    response.raise_for_status()

    chunks = []
    for chunk in response.iter_content(chunk_size=8192):
        if time.monotonic() - start > timeout:
            response.close()
            raise requests.exceptions.Timeout('Total timeout exceeded')
        chunks.append(chunk)

    return b''.join(chunks)
The fix didn’t address the user’s underlying reference to a non-RSS feed, so I wanted to figure out which customer this was affecting. I asked Claude Code to help me find the customer, and it came back with SQL to query for the RSS feed integration that the customer set up on their website. I had to modify the SQL to have it run on our data warehouse, as Claude wrote the query for our production database. The query Claude provided was again overly complicated, so I removed a bunch of joins and ran it and…it found the customer! This was still a time-saving query for me: unlike data sets such as our funnel, I haven’t written queries to extract data about integrations in a long while (ever?), so having a starting point was a great help.
Having shipped the fix and sent a message out to our support team to contact the customer, I headed to bed earlier than I would have if I had to investigate the issue solo.
Some takeaways
Since using Claude Code in this incident, we’ve relied on it during one subsequent incident around an esoteric one-off in how our hosting stack handles wildcard TLS certificates to pretty good effect. The goal of this blog post wasn’t to tell you all about core dumps and certificates, though. I’m sharing these stories because they expanded my understanding of where we can utilize agents in our engineering processes. Here are a few broader thoughts to that end:
- With an agent assisting me, I went from problem to solution-on-production in about 2.5 hours. Without the agent’s help, I’d have spent hours just learning to parse core dumps and might not have connected the dots to that specific URL. Futzing with files inside the docker container on a full disk would likely take me 1+ hours to figure out, whereas with the agent I had a solution in minutes. I could see spending hours to read about the core dump file format and learn about command-line utilities, and even then I’m not convinced I would have found the right segment of memory or had the patience to look across all of the core dumps to spot the repeating URL. Even if I saw the URL, it wasn’t so obviously a “this is a stream” URL, but somehow the agent pattern-matched the URL as containing streaming content. My guess is after a few hours, I wouldn’t have connected the dots. Even if an oracle told me the problem, writing the working solution (~20 lines of code) would have been easy, but taken maybe an hour or two to understand all of the interactions between the
timeoutparameter inrequests(which I’m familiar with) and thestreamkwarg anditer_contentmethod (which I’m not familiar with). - I don’t know how things would have turned out if I was left to figure this out without an agentic assistant, but my strong suspicion is that I would have come up with a different and less specific solution. It was late at night during the holidays, and I had evidence I didn’t have as much experience in handling. Taking too long to figure out a root cause would have required manual babysitting servers during the investigation, and my bias would likely have been to apply duct tape. To cut corners, I might have even decided to delete some core dumps so I could
docker cpothers onto the host machine and thenscpthem off the machine, trading off less evidence for a faster start to inspecting the files. Forcing myself to think through the evidence in front of me and the lack of clarity on how to transport and meaningfully process the core dumps, I think my “solve the incident now” instinct would be to write a script that runs periodically, checks for core dumps, copies them somewhere like S3 and alerts us, and removes them from the container. This would have been workable in the sense that the servers would no longer have disk usage issues, but it would have kicked the can down the road without any real understanding of the root cause. - Despite all of the heavy lifting Claude Code did, I still felt like an active participant in the process. Claude Code doesn’t run on our production servers, so I was the one who explored directories until I found out that Docker volumes were taking up extra disk space, explored the container to find the large files, and then spun up Claude to ask how I might stream the core dumps through ssh and through Docker. When given a SQL query as a starting point, I simplified it and translated it into something that would work on our data warehouse. When shown an initial fix to the code, I iterated twice through a change of library and a change of approach to implementing the timeout. And finally, I communicated with our customer success team to reach out to the customer and packaged up a PR to have a fellow engineer review. So while it saved me time, I still felt very engaged in the problem.
- Beyond all the anthropomorphizing you could do about Claude gaining an understanding of the problem at hand, my read of the transcript of individual tool calls afterward suggests that it found bits of evidence (a signal, a signal type, a profiling trace, an endpoint, a query parameter) and
greped its way between these bits of evidence to surface and then filter through new bits of evidence. There are several steps along this chain that I didn’t have the knowledge to complete, specifically in identifying that the program received a signal and in parsing the core dump to identify which signal. By virtue of Claude “knowing” how to parse through these blobs, it was able to jump from one string search to another to uncover the next element to parse. - While I now have core dumps on my “curious things to learn about” list, the incident was the wrong time to get too curious about them. Prior to this incident, I was a one-trick pony when it came to core dumps: run
stringson them and see if you can find any hints. There are MANY strings in a gigabyte-sized dump of memory, so my trick didn’t quite help. I’ve used web search during previous incidents to learn about a file format or better understand how to debug something. But being able to say “hey Claude, can you get anything meaningful from these files while I collect other clues” allowed me to defer my curiosity to a less stressful moment. - While it was cool that the coding agent wrote Python programs to read program registers, investigate bytecode, and dig into what was in memory with a makeshift hex editor, I’m not sure those tricks gave it the clues it needed to identify the root cause. Ultimately the presence of some profiling traces that the program was meant to send to Sentry did the trick. That said, the game of whack-a-mole that the agent played is not unlike the investigation process I go through: when you start looking for clues, you often sift through a bunch of noise before getting to something meaningful. In a coding agent’s case, the noise can come in the form of programs it writes in seconds. One leg up we have as humans is that it’s more expensive for us to emit code, so we generate less noise in our investigations. But that also means we stumble across fewer signals (no pun intended) as we investigate.
The expansion from “assists with bugs and features” to “assists in incident investigations” makes me feel like “coding agent” is not a descriptive enough term for the types of use cases you can bring one of these agents onto. I hesitate to start giving a single tool like Claude Code multiple categories (e.g., “It’s a coding agent AND a site reliability engineering agent!”). Perhaps something that more broadly encompasses the role of the person calling out to the agent, like “software engineering agent” would help prime people in that role to bring it in to help in more aspects of their day-to-day? Of course that might be misleading in that it’s not a software engineer replacement, so I’m not sure how to best refer to these expanded assistive capabilities. Regardless, if you’re stuck during an incident, consider a coding agent!